March 20, 2011
My first GGW post
My post from a couple weeks ago on DC land/water area has been picked up by Greater Greater Washington. My first GGW post...and it probably won't be my last, as I'm talking with David Alpert about possibly writing some Alexandria and southeast Fairfax County articles for GGW. Hopefully I'll get one of them written later today.
March 16, 2011
Apologies
Apologies to those of you who read my blog via an RSS feed. It appears that when I edited my old posts to include labels, it reposted EACH ONE on my RSS feed. This was not intentional, but now that everything's labeled, it shouldn't happen again.
March 15, 2011
Blog redesign/rebranding
If you follow my blog with any regularity, you'll notice a new look and a new name tonight. Given my transportation focus in general and my more specific focus on Alexandria, Huntington, and the southeastern part of Fairfax County (along/east of Richmond Hwy), I decided to give a new name to the blog and do some layout revisions. I'm also adding labels to my blog posts for easier reference.
Thanks to Stephen Miller for the name idea...and thanks to Dan Reed for allowing me to steal the name concept...:o)
Thanks to Stephen Miller for the name idea...and thanks to Dan Reed for allowing me to steal the name concept...:o)
Bike facilities and such
Lots of things I need to catch up on with the blog (I have at least 3 items I'm backlogged on and need to write about), but for now, a quick bike bit.
Last week, the National Association of City Transportation Officials released their Urban Bikeway Design Guide. I haven't taken a deep look into it yet, but it appears to be a "best practices" guide for things like bike signage, bike lanes, cycletracks, and other bicycle facilities within an urban environment.
On a related note, FHWA recently posted a listing of bicycle facility and element types, their status in the MUTCD, and whether they were considered experimental.
Some good stuff to go through for urban bike advocates and aficionados...
March 07, 2011
DC's quadrants and land/water/park area
A question brought up on a recent WashCycle post asks about the land/water area and percentages for the four DC quadrants (SW, SE, NW, NE). So a quick project here, using shapefiles from DC OCTO.
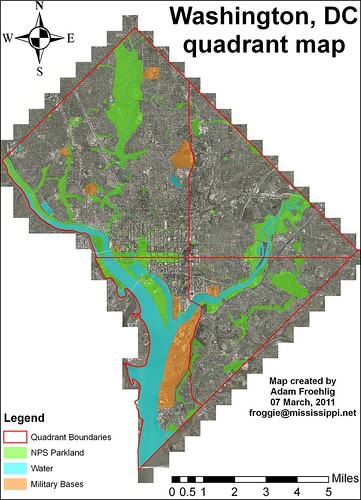
Here's a quick map I created using some of the shapefiles available from DC OCTO. Background image is 2008 ortho imagery. The red outline is the city boundary plus the quadrant boundaries. Blue-shaded polygons represent water, bright green shading represents NPS parkland and other while the orange shading represents military bases.
Total area (including water) comes out like this:
So Northwest is by far the largest quadrant, followed by Northeast. Only about 1/3 of the city is considered "south".
Water area (using OCTO's Water Polygon shapefile and includes the creeks and some ponds):
As you can see, DC's water is predominantly focused in Southwest, due largely to the Potomac, Washington Channel, and the Tidal Basin. Almost three-fourths of the city's "water area" is in Southwest, and almost half of Southwest's total area is covered by water. By comparison, water covers relatively little of Northeast or Southeast, even with the Anacostia River in both.
Subtracting out water area from the total yields Land Area:
As can be expected, Northwest has the lion's share of DC's land area, whereas less than 10% of the city's land area is in Southwest.
I didn't stop there, I also ran calculations for both National Park Service land (listed as NPS Map A) and military bases within DC.
NPS-parkland area (using OCTO's Parks Polygon shapefile)
Here, Northwest takes the lion's share, with half the city's total. NPS parkland also takes up a larger share of Northwest's total area than the other three quadrants. Roughly half of Northwest's NPS parkland is Rock Creek Park.
Military base/facility area (using OCTO's Military Locations Polygon shapefile, includes circles and triangles maintained by NPS)
Again, Southwest takes the lion's share, thanks to the joint Anacostia Naval-Bolling AFB base. Note how there are no military bases in Northeast.
Factoring out water area, NPS parkland, and military base area yields this remaining Land Area for each quadrant:
Some interesting conclusions here...while Northwest has the largest amount of non-NPS/non-military land in the city, both Southeast and Northeast have a higher percentage of their total area as non-NPS/non-military land. By comparison, Southwest has very little land available, and a large chunk of this is occupied by Federal office buildings near the Capitol and south of the National Mall.
Here's a quick map I created using some of the shapefiles available from DC OCTO. Background image is 2008 ortho imagery. The red outline is the city boundary plus the quadrant boundaries. Blue-shaded polygons represent water, bright green shading represents NPS parkland and other while the orange shading represents military bases.
Total area (including water) comes out like this:
Northwest: 29.21 square miles. 42.6% of the total.
Northeast: 15.52 square miles. 22.7% of the total.
Southwest: 11.02 square miles. 16.1% of the total.
Southeast: 12.73 square miles. 18.6% of the total.
So Northwest is by far the largest quadrant, followed by Northeast. Only about 1/3 of the city is considered "south".
Water area (using OCTO's Water Polygon shapefile and includes the creeks and some ponds):
Northwest: 1.11 square miles (mostly the Potomac). 15.3% of the city's water total. 3.8% of the quadrant's total area.
Northeast: 0.38 square miles (mostly the Anacostia). 5.2% of the city's water total. 2.4% of the quadrant's total area.
Southwest: 5.26 square miles (Potomac, Channel, Tidal Basin, part of the Anacostia, etc). 72.5% of the city's water total. 47.7% of the quadrant's total area.
Southeast: 0.51 square miles. 7% of the city's water total. 4% of the quadrant's total area.
As you can see, DC's water is predominantly focused in Southwest, due largely to the Potomac, Washington Channel, and the Tidal Basin. Almost three-fourths of the city's "water area" is in Southwest, and almost half of Southwest's total area is covered by water. By comparison, water covers relatively little of Northeast or Southeast, even with the Anacostia River in both.
Subtracting out water area from the total yields Land Area:
Northwest: 28.1 square miles. 45.9% of the city's land total. 96.2% of the quadrant's total area.
Northeast: 15.14 square miles. 24.7% of the city's land total. 97.6% of the quadrant's total area.
Southwest: 5.76 square miles. 9.4% of the city's land total. 52.3% of the quadrant's total area.
Southeast: 12.22 square miles. 20% of the city's land total. 96% of the quadrant's total area.
As can be expected, Northwest has the lion's share of DC's land area, whereas less than 10% of the city's land area is in Southwest.
I didn't stop there, I also ran calculations for both National Park Service land (listed as NPS Map A) and military bases within DC.
NPS-parkland area (using OCTO's Parks Polygon shapefile)
Northwest: 5.35 square miles. 51.4% of the city's NPS total. 18.3% of the quadrant's total area.
Northeast: 1.52 square miles (mostly Anacostia Park). 14.6% of the city's NPS total. 9.8% of the quadrant's total area.
Southwest: 1.52 square miles. 14.6% of the city's NPS total. 13.8% of the quadrant's total area.
Southeast: 2.01 square miles. 19.3% of the city's NPS total. 15.8% of the quadrant's total area.
Here, Northwest takes the lion's share, with half the city's total. NPS parkland also takes up a larger share of Northwest's total area than the other three quadrants. Roughly half of Northwest's NPS parkland is Rock Creek Park.
Military base/facility area (using OCTO's Military Locations Polygon shapefile, includes circles and triangles maintained by NPS)
Northwest: 0.42 square miles. 17.5% of the city's base total. 1.4% of the quadrant's total area.
Northeast: No military bases/facilities.
Southwest: 1.87 square miles. 77.9% of the city's base total. 17% of the quadrant's total area.
Southeast: 0.11 square miles. 4.6% of the city's base total. 0.9% of the quadrant's total area.
Again, Southwest takes the lion's share, thanks to the joint Anacostia Naval-Bolling AFB base. Note how there are no military bases in Northeast.
Factoring out water area, NPS parkland, and military base area yields this remaining Land Area for each quadrant:
Northwest: 22.33 square miles. 46.1% of the city's land total. 76.4% of the quadrant's total area.
Northeast: 13.62 square miles. 28.1% of the city's land total. 87.8% of the quadrant's total area.
Southwest: 2.37 square miles. 4.9% of the city's land total. 21.5% of the quadrant's total area.
Southeast: 10.1 square miles. 20.9% of the city's land total. 79.3% of the quadrant's total area.
Some interesting conclusions here...while Northwest has the largest amount of non-NPS/non-military land in the city, both Southeast and Northeast have a higher percentage of their total area as non-NPS/non-military land. By comparison, Southwest has very little land available, and a large chunk of this is occupied by Federal office buildings near the Capitol and south of the National Mall.
March 02, 2011
Complete Streets, Take 2
As I tweeted earlier, the big news out of tonight's Alexandria Transportation Commission meeting is that the commission voted to forward a revised Complete Streets resolution to City Council. Two more changes from even this revised one: the reporting will be every 6 months instead of annually, and language was inserted to revisit and "reaffirm" the resolution in 2 years.
I'll do a larger writeup on the meeting in the next couple days or so.
I'll do a larger writeup on the meeting in the next couple days or so.
Subscribe to:
Posts (Atom)