Adam's blog is now roaming the dirt roads of Vermont, chronicling transportation and travels one hill at a time...
Showing posts with label GIS. Show all posts
May 13, 2015
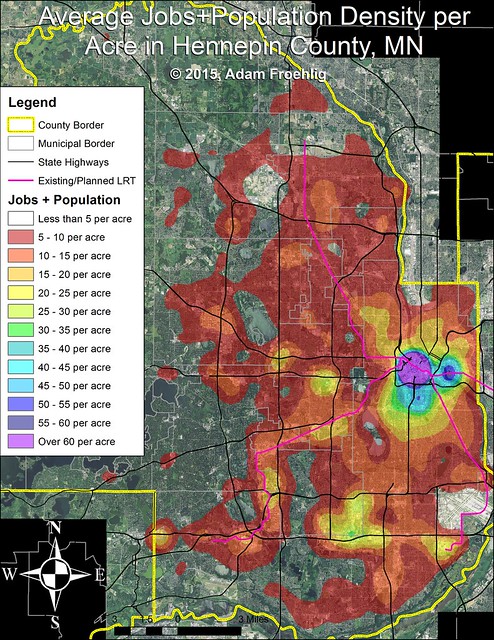
Average jobs+population density per acre for Hennepin County, MN.
Looking at figuring out a way to adjust for the larger census block sizes in some areas, as well as factoring out the lakes and wetlands.
Also turned it into a Streets.MN post.
September 19, 2011
Regional map data abounds, but is expensive
Detailed map data offers tremendous potential to expand our understanding of the world in which we live. Unfortunately, most localities in the immediate area charge for this data, which should be publicly available to everyone.
Past posts on Greater Greater Washington and here on Just Down The Parkway have featured user-created maps based on GIS (Geographic Information Systems) data from DC and Alexandria.
DC's GIS data availability in particular has been described as "a treasure trove of interesting information." There are numerous data layers available to the public for free at the city's GIS Data Catalog.
But DC is the only jurisdiction in the region that offers so much data for free. The City of Alexandria and every county in the immediate DC area charge for the same type of GIS data. Some charge exorbitant rates.
I contacted each jurisdiction's GIS office in order to determine the price charged for three common map layers: building footprints, zoning, and elevation contours. The prices are shown in this chart:

Alexandria and Loudoun charge a nominal price for CDs containing their full data set, which offers all of the GIS data they make available to the public. Arlington is similar but more expensive, as they separate their contour data from the rest and charge more for the contours. Prince William splits their land area up into several small geographic squares called "tiles," and then charges by tile instead of countywide. Fairfax provides countywide data, but charges a higher rate.
Even Fairfax is affordable compared to jurisdictions in Maryland, though. By comparison, both Montgomery and Prince George's charge excessive rates. They both charge "by tile," like Prince William, but with several hundred tiles within each county, the cost of full coverage skyrockets significantly.
There are some exceptions. Both Fairfax and Montgomery offer downloads of limited data for free. In Montgomery's case the free data comes as Google Earth "kml" files. However, the bulk of their GIS data, including the three layers mentioned above, comes at a price.
A number of free or low-cost GIS programs are available for the general public. As GIS becomes a more mainstream way to gather information, good data availability will become even more paramount. Making it available to the public at a nominal cost or free of charge is a good opportunity for jurisdictions to be more open with their residents, and to foster understanding and innovation.
It costs each jurisdiction virtually nothing to give the data to additional users. Some localities have argued in the past that they need to charge to recoup the cost of generating the data. However, that ignores the massive public good that comes from making it possible for people to create maps on their own, even if those maps will just get posted online somewhere and never earn anyone a dime.
Some area jurisdictions, DC in particular, have recognized this. It would behoove the other jurisdictions to follow suit.
Cross-posted on GreaterGreaterWashington.
Past posts on Greater Greater Washington and here on Just Down The Parkway have featured user-created maps based on GIS (Geographic Information Systems) data from DC and Alexandria.
DC's GIS data availability in particular has been described as "a treasure trove of interesting information." There are numerous data layers available to the public for free at the city's GIS Data Catalog.
But DC is the only jurisdiction in the region that offers so much data for free. The City of Alexandria and every county in the immediate DC area charge for the same type of GIS data. Some charge exorbitant rates.
I contacted each jurisdiction's GIS office in order to determine the price charged for three common map layers: building footprints, zoning, and elevation contours. The prices are shown in this chart:
Alexandria and Loudoun charge a nominal price for CDs containing their full data set, which offers all of the GIS data they make available to the public. Arlington is similar but more expensive, as they separate their contour data from the rest and charge more for the contours. Prince William splits their land area up into several small geographic squares called "tiles," and then charges by tile instead of countywide. Fairfax provides countywide data, but charges a higher rate.
Even Fairfax is affordable compared to jurisdictions in Maryland, though. By comparison, both Montgomery and Prince George's charge excessive rates. They both charge "by tile," like Prince William, but with several hundred tiles within each county, the cost of full coverage skyrockets significantly.
There are some exceptions. Both Fairfax and Montgomery offer downloads of limited data for free. In Montgomery's case the free data comes as Google Earth "kml" files. However, the bulk of their GIS data, including the three layers mentioned above, comes at a price.
A number of free or low-cost GIS programs are available for the general public. As GIS becomes a more mainstream way to gather information, good data availability will become even more paramount. Making it available to the public at a nominal cost or free of charge is a good opportunity for jurisdictions to be more open with their residents, and to foster understanding and innovation.
It costs each jurisdiction virtually nothing to give the data to additional users. Some localities have argued in the past that they need to charge to recoup the cost of generating the data. However, that ignores the massive public good that comes from making it possible for people to create maps on their own, even if those maps will just get posted online somewhere and never earn anyone a dime.
Some area jurisdictions, DC in particular, have recognized this. It would behoove the other jurisdictions to follow suit.
Cross-posted on GreaterGreaterWashington.
May 04, 2011
Alexandria GIS maps
Last week, BeyondDC posted a series of thematic maps of DC created using GIS data available from the DC Office of the Chief Technology Officer (OCTO). Maps were created for topography, building footprint, and basic land use.
Inspired by that, I created similar maps for Alexandria using data from the city's GIS Division.
Basic Land Use
This map simplifies the city's zoning into four categories: commercial, residential, designated mixed use/"coordinated development" zones, and other (everything else). The commercial corridors along King St, Washington St, and Mt Vernon Ave really stand out on this map, as do the designated mixed-use or "coordinated development" areas that reflect recent development (Carlyle), new development (Potomac Yard), or proposed redevelopment areas (Beauregard).

Figure Ground Map
These maps show building footprints. The first one is citywide, while the second one is a zoom-in showing Old Town, Carlyle, Rosemont, and the southern part of Del Ray. While not as "thick" as DC, there is some noticeable density in Old Town.


Topography
This map details the city's topography, with contours at 10 foot intervals. The highest point in the city is located in Fort Ward Park. Other noted areas of elevation are the ridge along Seminary Rd, the Landmark area, and the far southwestern corner of the city near the Beltway/Van Dorn St interchange (technically outside the city limits but included in the data package).
Some man-made and other features can also be easily seen in the topography, including I-395, the Beltway, the Beltway/Telegraph Rd interchange (before the Wilson Bridge-related construction began) and the CSX tracks. Also easily visible are the Cameron Run channel, Holmes Run, Backlick Run, and part of Four Mile Run.
Inspired by that, I created similar maps for Alexandria using data from the city's GIS Division.
Basic Land Use
This map simplifies the city's zoning into four categories: commercial, residential, designated mixed use/"coordinated development" zones, and other (everything else). The commercial corridors along King St, Washington St, and Mt Vernon Ave really stand out on this map, as do the designated mixed-use or "coordinated development" areas that reflect recent development (Carlyle), new development (Potomac Yard), or proposed redevelopment areas (Beauregard).
Figure Ground Map
These maps show building footprints. The first one is citywide, while the second one is a zoom-in showing Old Town, Carlyle, Rosemont, and the southern part of Del Ray. While not as "thick" as DC, there is some noticeable density in Old Town.
Topography
This map details the city's topography, with contours at 10 foot intervals. The highest point in the city is located in Fort Ward Park. Other noted areas of elevation are the ridge along Seminary Rd, the Landmark area, and the far southwestern corner of the city near the Beltway/Van Dorn St interchange (technically outside the city limits but included in the data package).
Some man-made and other features can also be easily seen in the topography, including I-395, the Beltway, the Beltway/Telegraph Rd interchange (before the Wilson Bridge-related construction began) and the CSX tracks. Also easily visible are the Cameron Run channel, Holmes Run, Backlick Run, and part of Four Mile Run.
March 07, 2011
DC's quadrants and land/water/park area
A question brought up on a recent WashCycle post asks about the land/water area and percentages for the four DC quadrants (SW, SE, NW, NE). So a quick project here, using shapefiles from DC OCTO.

Here's a quick map I created using some of the shapefiles available from DC OCTO. Background image is 2008 ortho imagery. The red outline is the city boundary plus the quadrant boundaries. Blue-shaded polygons represent water, bright green shading represents NPS parkland and other while the orange shading represents military bases.
Total area (including water) comes out like this:
So Northwest is by far the largest quadrant, followed by Northeast. Only about 1/3 of the city is considered "south".
Water area (using OCTO's Water Polygon shapefile and includes the creeks and some ponds):
As you can see, DC's water is predominantly focused in Southwest, due largely to the Potomac, Washington Channel, and the Tidal Basin. Almost three-fourths of the city's "water area" is in Southwest, and almost half of Southwest's total area is covered by water. By comparison, water covers relatively little of Northeast or Southeast, even with the Anacostia River in both.
Subtracting out water area from the total yields Land Area:
As can be expected, Northwest has the lion's share of DC's land area, whereas less than 10% of the city's land area is in Southwest.
I didn't stop there, I also ran calculations for both National Park Service land (listed as NPS Map A) and military bases within DC.
NPS-parkland area (using OCTO's Parks Polygon shapefile)
Here, Northwest takes the lion's share, with half the city's total. NPS parkland also takes up a larger share of Northwest's total area than the other three quadrants. Roughly half of Northwest's NPS parkland is Rock Creek Park.
Military base/facility area (using OCTO's Military Locations Polygon shapefile, includes circles and triangles maintained by NPS)
Again, Southwest takes the lion's share, thanks to the joint Anacostia Naval-Bolling AFB base. Note how there are no military bases in Northeast.
Factoring out water area, NPS parkland, and military base area yields this remaining Land Area for each quadrant:
Some interesting conclusions here...while Northwest has the largest amount of non-NPS/non-military land in the city, both Southeast and Northeast have a higher percentage of their total area as non-NPS/non-military land. By comparison, Southwest has very little land available, and a large chunk of this is occupied by Federal office buildings near the Capitol and south of the National Mall.
Here's a quick map I created using some of the shapefiles available from DC OCTO. Background image is 2008 ortho imagery. The red outline is the city boundary plus the quadrant boundaries. Blue-shaded polygons represent water, bright green shading represents NPS parkland and other while the orange shading represents military bases.
Total area (including water) comes out like this:
Northwest: 29.21 square miles. 42.6% of the total.
Northeast: 15.52 square miles. 22.7% of the total.
Southwest: 11.02 square miles. 16.1% of the total.
Southeast: 12.73 square miles. 18.6% of the total.
So Northwest is by far the largest quadrant, followed by Northeast. Only about 1/3 of the city is considered "south".
Water area (using OCTO's Water Polygon shapefile and includes the creeks and some ponds):
Northwest: 1.11 square miles (mostly the Potomac). 15.3% of the city's water total. 3.8% of the quadrant's total area.
Northeast: 0.38 square miles (mostly the Anacostia). 5.2% of the city's water total. 2.4% of the quadrant's total area.
Southwest: 5.26 square miles (Potomac, Channel, Tidal Basin, part of the Anacostia, etc). 72.5% of the city's water total. 47.7% of the quadrant's total area.
Southeast: 0.51 square miles. 7% of the city's water total. 4% of the quadrant's total area.
As you can see, DC's water is predominantly focused in Southwest, due largely to the Potomac, Washington Channel, and the Tidal Basin. Almost three-fourths of the city's "water area" is in Southwest, and almost half of Southwest's total area is covered by water. By comparison, water covers relatively little of Northeast or Southeast, even with the Anacostia River in both.
Subtracting out water area from the total yields Land Area:
Northwest: 28.1 square miles. 45.9% of the city's land total. 96.2% of the quadrant's total area.
Northeast: 15.14 square miles. 24.7% of the city's land total. 97.6% of the quadrant's total area.
Southwest: 5.76 square miles. 9.4% of the city's land total. 52.3% of the quadrant's total area.
Southeast: 12.22 square miles. 20% of the city's land total. 96% of the quadrant's total area.
As can be expected, Northwest has the lion's share of DC's land area, whereas less than 10% of the city's land area is in Southwest.
I didn't stop there, I also ran calculations for both National Park Service land (listed as NPS Map A) and military bases within DC.
NPS-parkland area (using OCTO's Parks Polygon shapefile)
Northwest: 5.35 square miles. 51.4% of the city's NPS total. 18.3% of the quadrant's total area.
Northeast: 1.52 square miles (mostly Anacostia Park). 14.6% of the city's NPS total. 9.8% of the quadrant's total area.
Southwest: 1.52 square miles. 14.6% of the city's NPS total. 13.8% of the quadrant's total area.
Southeast: 2.01 square miles. 19.3% of the city's NPS total. 15.8% of the quadrant's total area.
Here, Northwest takes the lion's share, with half the city's total. NPS parkland also takes up a larger share of Northwest's total area than the other three quadrants. Roughly half of Northwest's NPS parkland is Rock Creek Park.
Military base/facility area (using OCTO's Military Locations Polygon shapefile, includes circles and triangles maintained by NPS)
Northwest: 0.42 square miles. 17.5% of the city's base total. 1.4% of the quadrant's total area.
Northeast: No military bases/facilities.
Southwest: 1.87 square miles. 77.9% of the city's base total. 17% of the quadrant's total area.
Southeast: 0.11 square miles. 4.6% of the city's base total. 0.9% of the quadrant's total area.
Again, Southwest takes the lion's share, thanks to the joint Anacostia Naval-Bolling AFB base. Note how there are no military bases in Northeast.
Factoring out water area, NPS parkland, and military base area yields this remaining Land Area for each quadrant:
Northwest: 22.33 square miles. 46.1% of the city's land total. 76.4% of the quadrant's total area.
Northeast: 13.62 square miles. 28.1% of the city's land total. 87.8% of the quadrant's total area.
Southwest: 2.37 square miles. 4.9% of the city's land total. 21.5% of the quadrant's total area.
Southeast: 10.1 square miles. 20.9% of the city's land total. 79.3% of the quadrant's total area.
Some interesting conclusions here...while Northwest has the largest amount of non-NPS/non-military land in the city, both Southeast and Northeast have a higher percentage of their total area as non-NPS/non-military land. By comparison, Southwest has very little land available, and a large chunk of this is occupied by Federal office buildings near the Capitol and south of the National Mall.
Subscribe to:
Posts (Atom)
